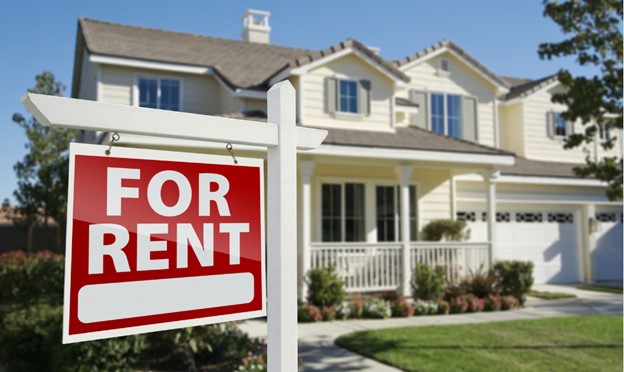
Most Renters Are Paying Far More Than Their Landlord’s Mortgage
 It is not uncommon for renters to pay more in rent than their landlord’s mortgage payment. This is because landlords are typically looking to make a profit on their rental properties, and they will often set their rent prices based on market rates rather than the cost of their mortgage.
There are several reasons why renters often pay more than a mortgage payment:
Renters are not building equity: When you make a mortgage payment, you are building equity in your home. Equity is the value of your home that you actually own. As you pay down your mortgage, you own more and more of your home. Renters, on the other hand, are not building equity in their homes. They are simply paying for the use of the property.
Renters don’t get tax benefits: Homeowners can deduct their mortgage interest and property taxes from their income taxes, which can save them a significant amount of money. Renters, on the other hand, do not get these tax benefits.
Landlords have to cover maintenance costs: When you rent a property, the landlord is responsible for maintenance and repairs. This includes everything from fixing a leaky faucet to replacing a roof. These costs are factored into the rent payment, so renters end up paying for these expenses indirectly.
Supply and demand: Depending on the area and the rental market, there may be more demand for rental properties than there is supply. This can drive up rental prices, making them higher than mortgage payments.
Location: In some areas, it may simply be more expensive to rent than it is to buy a home. This can be due to a variety of factors, such as high demand, limited supply, or a desirable location.
Overall, there are many factors that can contribute to renters paying more than a mortgage payment. It’s important to note that while renters may feel like they are paying more than their landlord’s mortgage, they are also benefiting from the convenience and flexibility of renting. Renters typically do not have to worry about property maintenance or repair costs, and they have the ability to move more easily than homeowners. Renting can still be a good choice for some people, depending on their financial situation and lifestyle.

 Last week’s economic reporting included readings from S&P Case-Shiller Home Price Indices on home prices, reports on U.S. jobs growth, and the national unemployment rate. Weekly readings on mortgage rates and jobless claims were also released.
 March readings for the S&P Case-Shiller National Home Price Index showed that month-to-month home prices rose by 0.40 percent in March. The 20-City Home Price Index, which is considered a benchmark indicator by U.S. real estate professionals, rose by 0.50 percent month-to-month in March but posted a negative reading of -1.10 percent year-over-year. Analysts said that the slim supply of homes for sale drove up prices as demand for homes exceeded available inventory.